
Church Rock’s Thorium Settled Where the Flood Slowed Down
Dust sampled in Gallup after the 1979 Church Rock tailings spill showed only background radioactivity. The spill's record was in the riverbed, sorted into pockets by the flood's energy, along a reach far longer than the stretch that was cleaned.
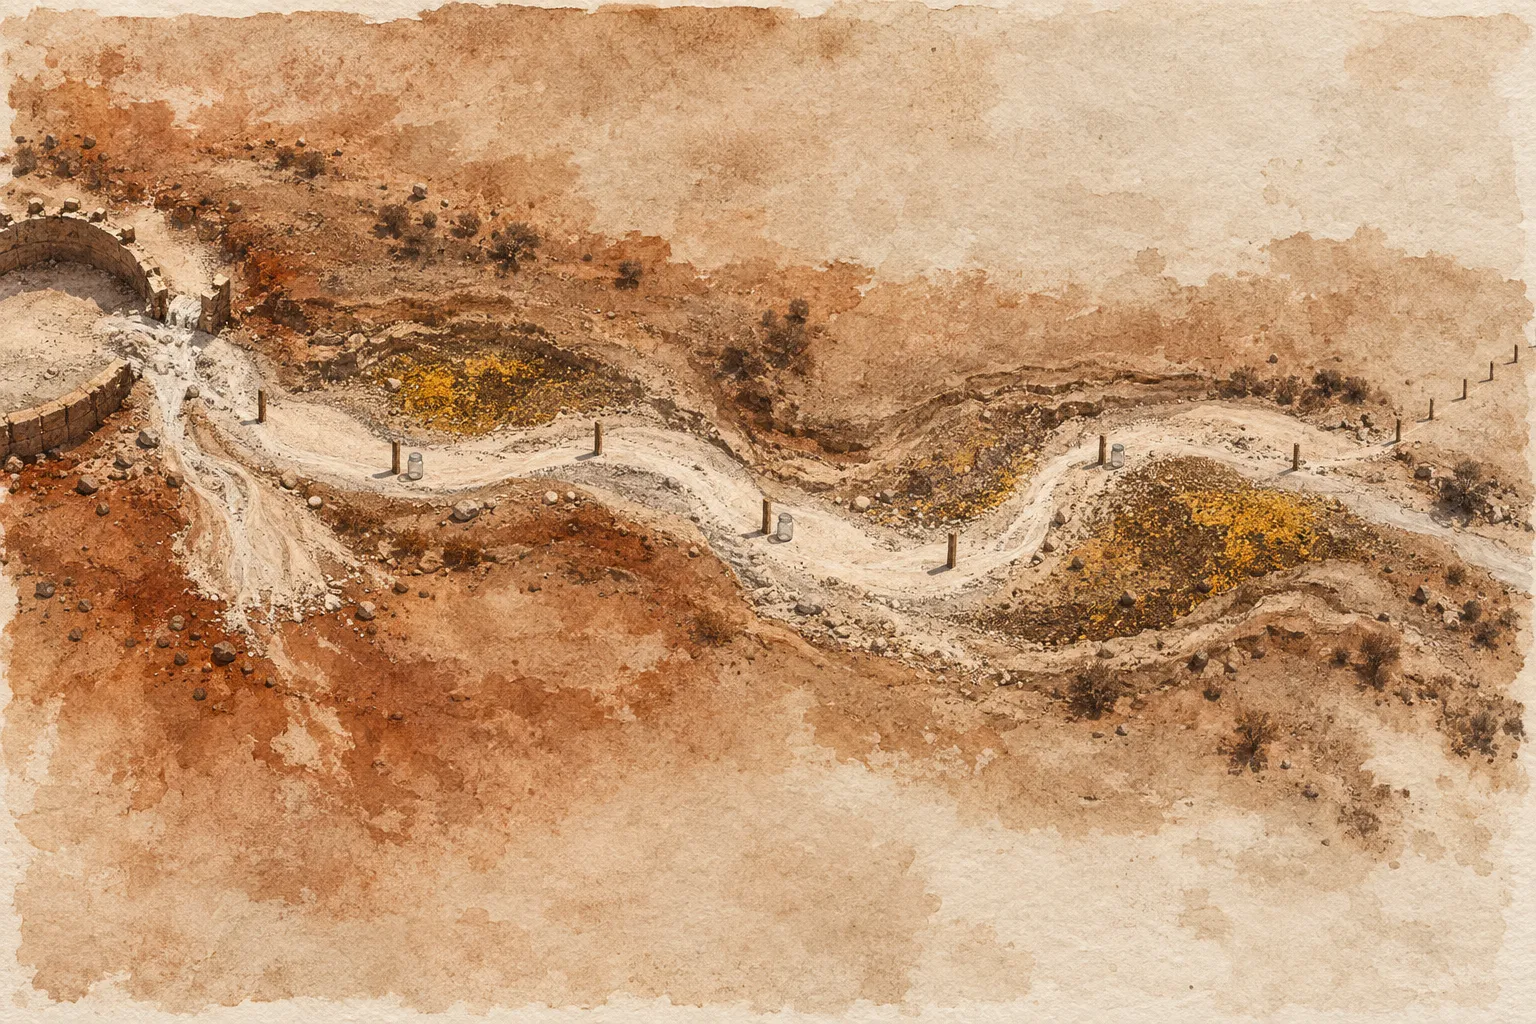
After the Church Rock tailings spill of July 16, 1979, computer modeling pointed to the air. Inhalation, the models said, was the most significant way people could be exposed. But dust sampled in Gallup soon after the spill showed only background radioactivity. The spill’s record turned up somewhere else: in the mud of Pipeline Arroyo and the Puerco River, carried mainly by thorium-230, an isotope whose weak gamma emissions make it difficult to detect with gamma instruments.
That record was hard to read, and the cleanup covered only a small part of it. A 1990 study by W.L. Graf found that the flood wave distributed thorium-230 through a reach of the river about 50 miles (80 km) long. According to the Science History Institute, hot spots were scraped only from the first five miles of the riverbed. And the thorium didn’t settle in a trail that faded steadily with distance from the mill. The flood sorted it into pockets.
What Came Out of the Church Rock Dam
Early that morning, the retention dam holding back a tailings pond at the uranium mill near Church Rock, New Mexico, failed. About 94 million gallons of mill waste fluids and 1,100 tons of tailings solids came out. A small emergency catchment dam caught most of the solids, but most of the liquid ran into Pipeline Arroyo, a tributary of the Puerco River, also called the Rio Puerco. New Mexico’s environmental regulators described the spill as the largest single release of liquid radioactive waste recorded in the United States, and the fifth largest release of solid radioactive waste.
The nuclides of concern were mainly uranium-238, thorium-230, radium-226, lead-210 and polonium-210. They went into a river that was already carrying mine water. Until 1980, according to the Science History Institute, mining and milling companies discharged untreated water into the Rio Puerco at a rate of 2.8 billion gallons per year.
Thorium-230, an Alpha Emitter With a Faint Gamma Signal
The U.S. Environmental Protection Agency (EPA) lists thorium’s emissions as alpha particles and weak gamma rays, and gives thorium-230 a half-life of 77,000 years. It decays by alpha emission to radium-226, according to the EPA’s radionuclide decay-chain tool.
That emission profile sets the exposure route. In the EPA’s words, alpha particles “pose no direct or external radiation threat; however, they can pose a serious health threat if ingested or inhaled.” So thorium-230 is mainly an internal hazard. That’s why the modelers focused on breathing contaminated material, and why thorium-230 in a riverbank doesn’t, by itself, show that anyone took any in.
Sampling Sediment Along Pipeline Arroyo and the Rio Puerco
A Battelle team at Pacific Northwest National Laboratory collected sediment samples between Sept. 24 and Oct. 5, 1979. The team laid out sampling sites roughly every 500 feet along Pipeline Arroyo and the Rio Puerco, from the mill to the Arizona line, and took samples at alternate sites. They measured lead-210, radium-226, thorium-230 and uranium-238. The survey was published in December 1981.
The state’s own follow-up found that a year after the spill, sediment radioactivity had dropped significantly, and thorium-230 levels were down 70 percent. The state attributed the decline to dilution. With a half-life of 77,000 years, a year of decay accounts for almost none of that drop. The thorium had mostly moved, or been mixed with cleaner sediment, rather than disappeared.
How Stream Power Decided Where Thorium-230 Settled
Where it moved to was the question Graf took up in the Annals of the Association of American Geographers. A simple picture would have concentrations falling off steadily downstream of the mill. They didn’t. Graf found that thorium-230 concentrations fluctuated irregularly with increasing distance from the source.
What tracked them was unit stream power, a measure of how much energy flowing water spends on each unit area of its bed. At the flood peak, thorium-230 concentrations were inversely related to it. Where the water ran hardest, less contaminated sediment stayed behind. Where it slackened, more of it settled. The hydraulics of a single flood decided where the pockets formed, and distance from the mill was only part of the story.
Cleanup at the Mill, the River and the Mines
The mill itself operated from 1977 to 1982. United Nuclear Corporation reclaimed the site’s cells and pits between 1989 and 1995 under Nuclear Regulatory Commission direction, according to the New Mexico Environment Department’s review of the Church Rock mill site. The EPA lists the property as the United Nuclear Corp. Superfund site. The agency says the mill’s operations contaminated soil and groundwater, a finding about the site as a whole rather than the spill alone, and that the groundwater remedy is being reassessed for long-term effectiveness.
Downstream, separating the spill from everything else in the river has stayed difficult. The Southwest Research and Information Center, an advocacy group, reports ongoing uranium contamination of alluvial groundwater near Sanders, Arizona, and says the role of the mine water is still being investigated.
The mines have their own chapter. In 2023, the Nuclear Regulatory Commission approved a plan by United Nuclear Corporation to dispose of waste from the Northeast Church Rock mine at the mill site, as the American Nuclear Society’s Nuclear Newswire reported. In August 2025, the EPA announced a consent decree under which United Nuclear Corporation and General Electric would carry out a cleanup valued at roughly $63 million.
Graf’s result limits what any single sample from the riverbed can say. Concentrations rose and fell with the flood’s energy instead of fading with distance, so a clean reading from one stretch of channel says little about the stretch beside it. The Gallup dust showed the same limit from another direction: it tested the pathway the models expected and found background. In both cases the answer depended on looking where the flood had actually put the material, and the scraping stopped five miles into a reach ten times that long.
About the sources: Spill quantities, nuclides of concern, modeling and follow-up findings come from the New Mexico Environmental Improvement Division’s health and environmental assessment of the spill, hosted by the EPA. The survey record is a Battelle/Pacific Northwest National Laboratory report listed at the Office of Scientific and Technical Information. Graf’s findings come from his 1990 journal article. The Southwest Research and Information Center is an advocacy organization, and its statements are attributed as such.
Edited by a healthcare imaging professional with more than 25 years of experience in the field. How we report and edit.
Read next